iPath Series B Carbon ETN (GRN) Drops Below 200-Day Moving Average to $28.87 — What’s Next?
iPath Series B Carbon ETN (GRN) fell below its 200-day moving average ($31.66) to $28.87. Read what this technical shift means for traders now. Updated outlook
Page views: 2
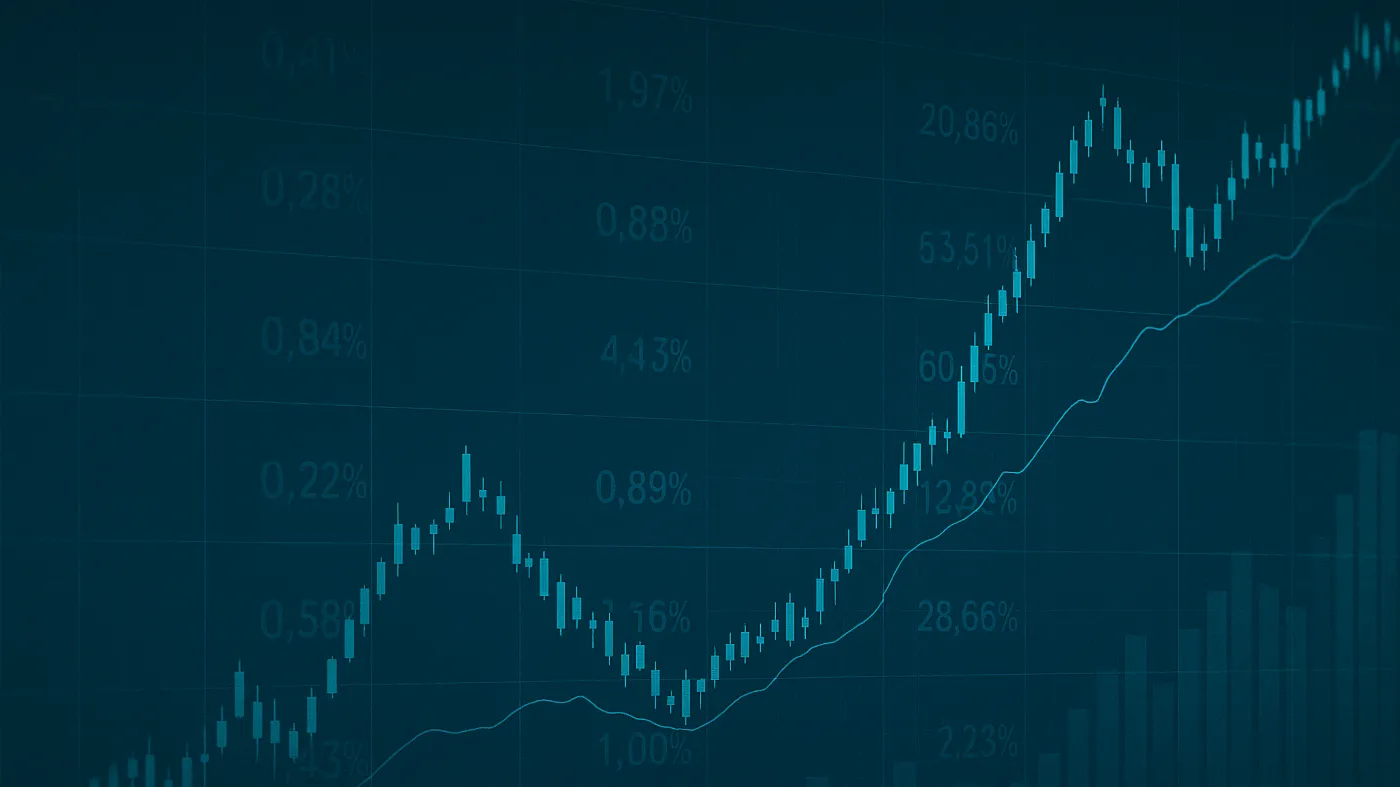
The iPath Series B Carbon ETN (NYSEARCA: GRN) slipped below its 200-day moving average during Friday trading, closing the session at $28.87 after trading as low as $28.87. With a 200-day moving average of $31.66 and just 88 shares changing hands on the move, this technical break raises questions about momentum, support, and what comes next for GRN.
A close below the 200-day moving average is often viewed as a bearish signal for traders who follow technical analysis. For GRN, the drop under $31.66 suggests the ETN’s intermediate-term trend may be weakening. However, the very light trading volume — only 88 shares reported — suggests the move lacked conviction from sellers, which tempers the immediate significance of the breakdown.
What traders should watch next: first, look for confirmation. A follow-through day with higher trading volume and additional downside would strengthen the bearish case. Conversely, a quick rebound that retests the 200-day moving average and fails to clear it could turn the former support into resistance. Monitoring short-term indicators like the 50-day moving average, RSI, and volume spikes will help confirm whether this is a genuine trend shift or a short-term dip.
Key support and risk levels to consider: the recent low of $28.87 is now the short-term support to watch. If GRN breaks decisively below that level on meaningful volume, more downside could follow. On the upside, reclaiming and holding above $31.66 would be a bullish sign and could attract traders looking for a mean-reversion play.
Remember the backdrop: GRN is an ETN that provides exposure to carbon market instruments, so fundamentals — regulatory developments, carbon credit prices, and global climate policy — can quickly affect price action. Technical signals should be considered alongside these fundamental drivers.
For investors and traders, risk management is critical. Use position sizing, predefined stop-loss levels, and keep an eye on volume as a confirmation tool. If you’re unsure how to interpret the technical break in GRN, consider consulting a financial advisor or combining technical insights with a review of the ETN’s underlying exposure before making trading decisions.
Published on: February 23, 2026, 12:07 pm


